Data Science
Natural Language Processing
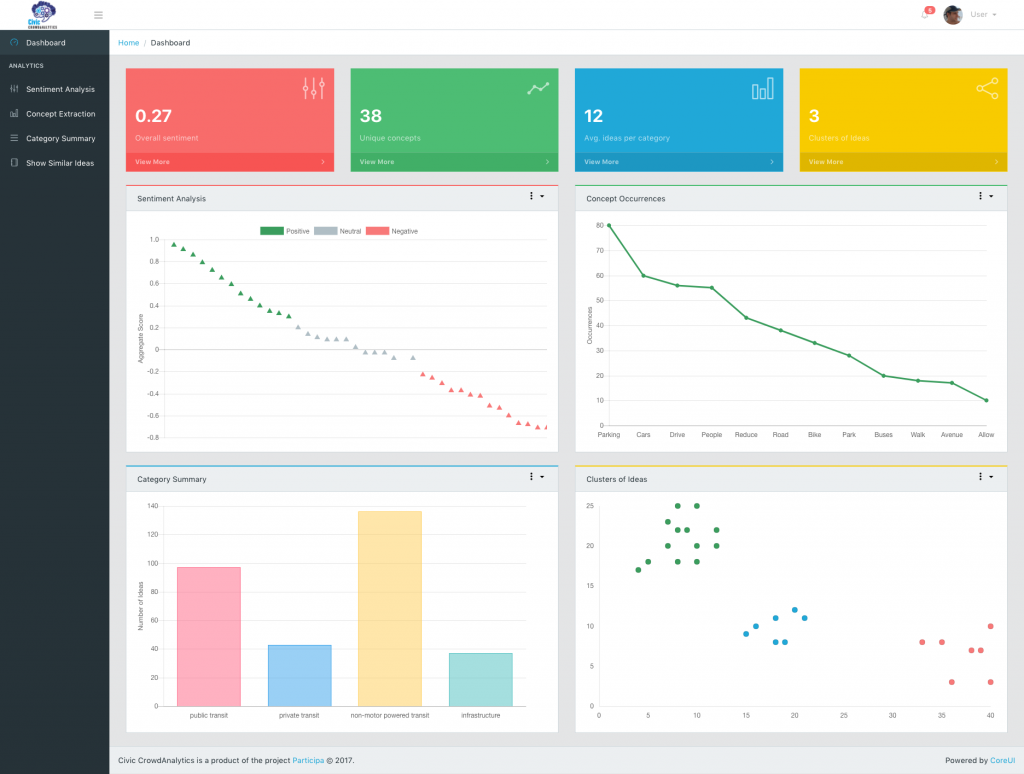
Civic CrowdAnalytics
Analytics tool that applies Natural Language Processing (NLP) and Machine Learning (ML), such as concept extraction, idea classification, and sentiment analysis to make sense of crowdsourced civic input. Tools: Python, Pandas, Scikit-learn, NLTK, VueJs → Github, Article
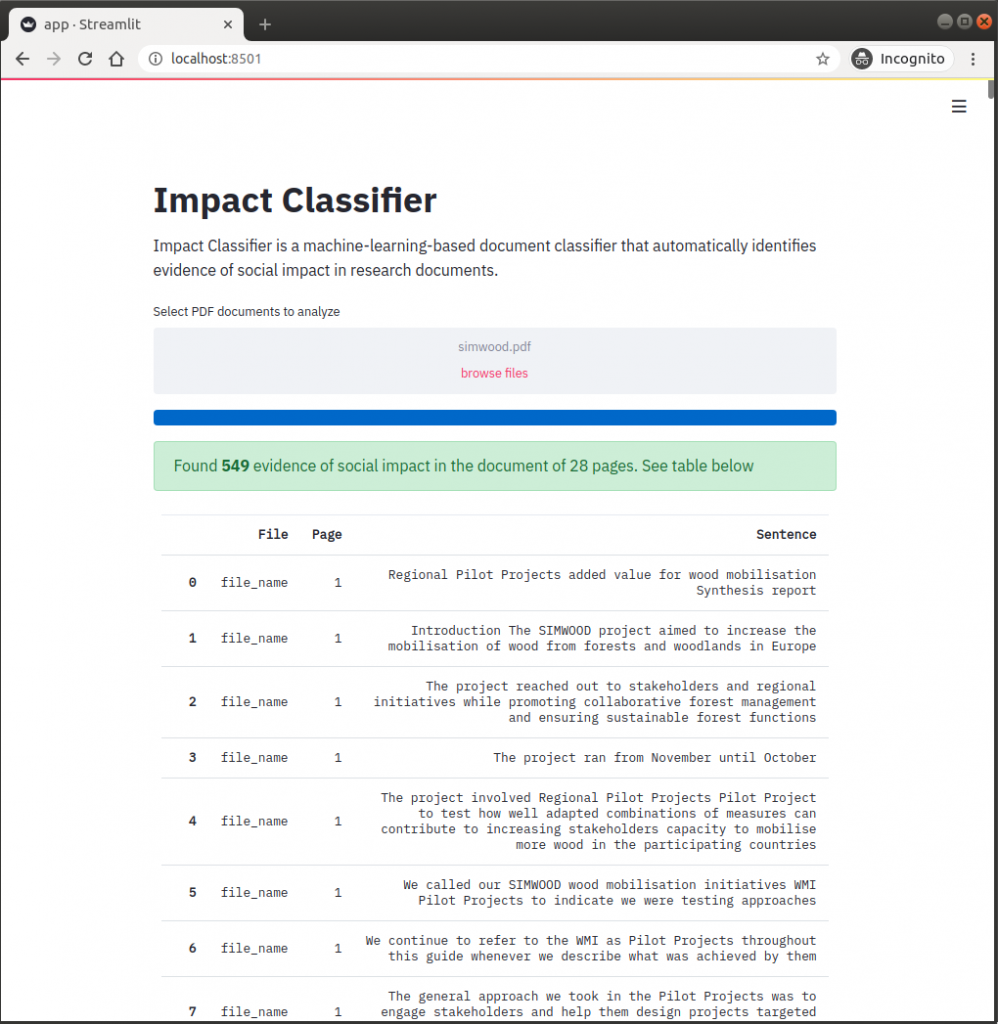
Impact Classifier
Impact classifier is a project that proposes to leverage machine learning (ML) and natural language processing (NLP) techniques to build a text classifier that facilitates the identification of evidence of social impact in research documents. Tools: Python, NLTK, Spacy, Pandas, Matplotlib, Scikit-learn, Steamlit → Github
Machine Learning
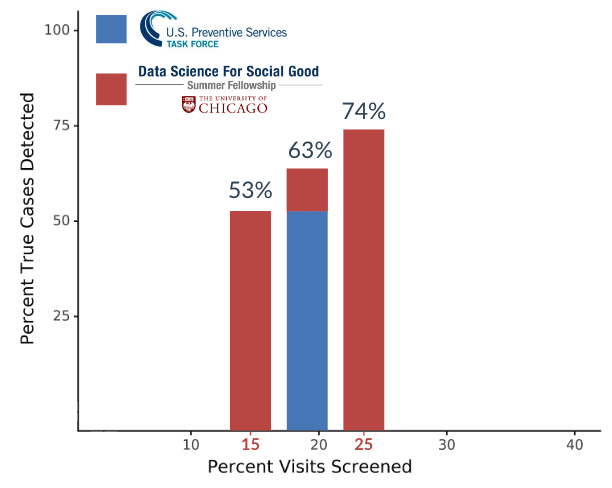
Supporting Proactive Diabetes Screenings to Improve Health Outcomes
The tool is a predictive model for a person’s risk of developing type 2 diabetes in the next years. The model showed a 10 percentage point increase at the same screening rate as current practices. Tools: Python, Pandas, Scikit-learn, Matplotlib, SQL → Web
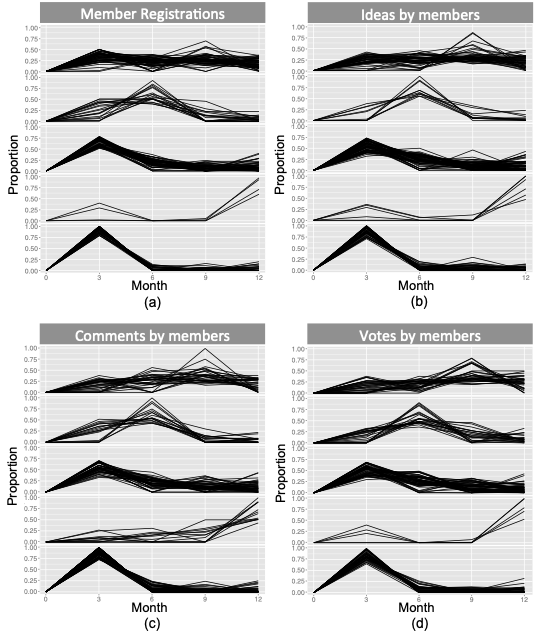
Collective behavior in online communities
Used the K-means algorithm and non-parametric statistical tests (Chi-square, Kruskal-Wallis) to discover patterns in the collective behavior of online innovation communities. Tools: R, ggplot2, dplyr → Github, Article
Data Analysis
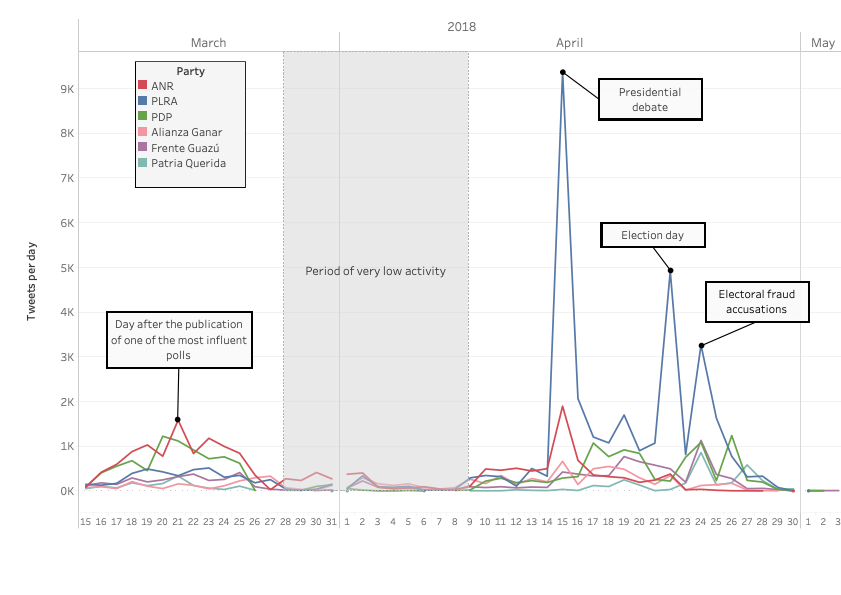
Politic Bots
Employed exploratory data analysis (EDA) techniques and social network analysis (SNA) to understand the role of Twitter during the 2018 national elections in Paraguay. Tools: Python, Pandas, Numpy, Matplotlib, MongoDB → Github, Article
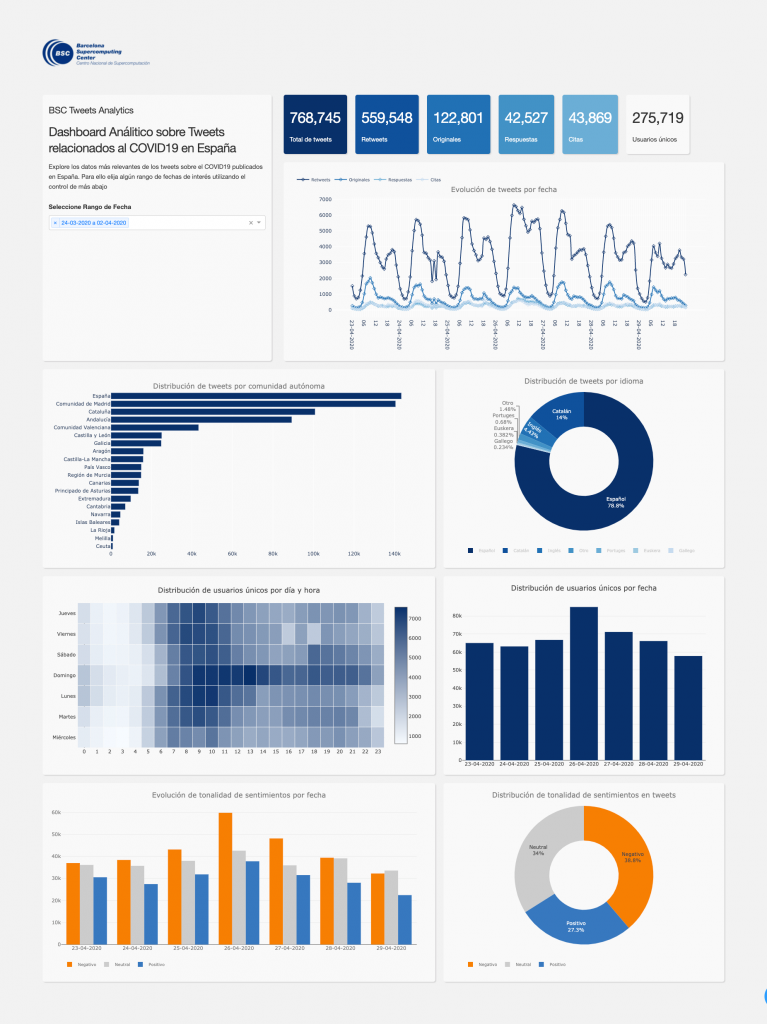
Characterizing Covid-19 conversations on Twitter
Collected, processed, analyzed through exploratory data analyzed, and visualized conversations on Twitter about the pandemic Covid-19. Tools: Python, Pandas, Matplotlib, Plotly, MongoDB → Github
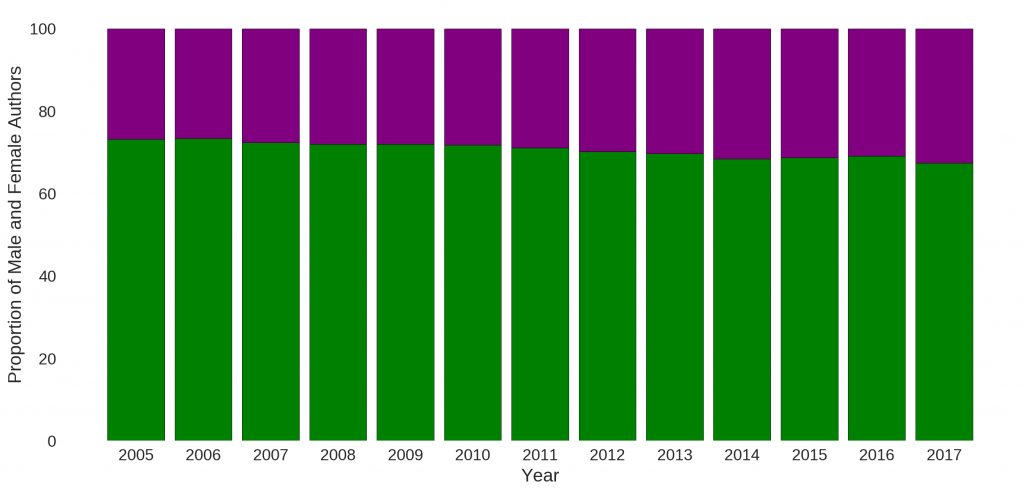
Gender bias in Bioinformatics Research
A quantitative study of more than 40k articles to examine the problem of gender bias in the field of Bioinformatics. Tools: Python, Pandas, Matplotlib, Numpy → Github, Article
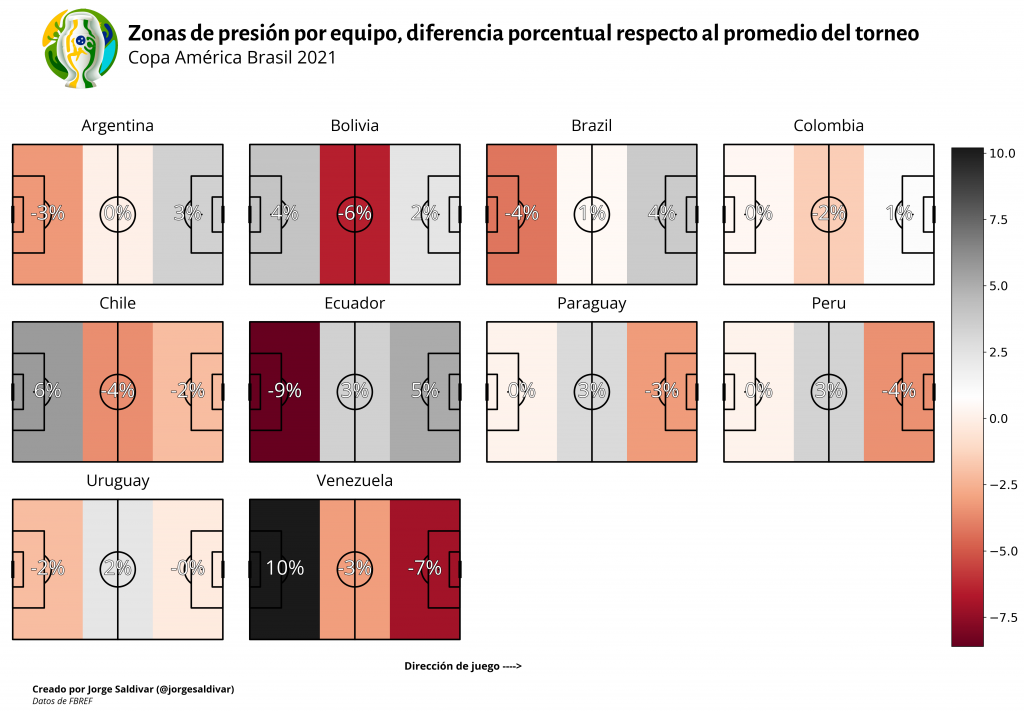
Deep dive into the Copa America Brazil 2021
Exploratory data analysis of teams and players that compete at the Copa America Brazil 2021. Tools: Python, Pandas, Matplotlib → Github
Course
Data Science for social impact. Catholic University of Asunción. October to December 2017. → Github